tl;dr
On Day 2 of the launch week, we're elevating your data experience with Outerbase by introducing instant chart generation from database queries, customizable dashboards, and a new experimental feature with EZQL that auto-generates dashboards. Plus, share your insights effortlessly with our new embeddable charts and dashboards. Stay tuned for more customization and embedding capabilities coming soon.

Transforming Queries into Visual Insights: Charts and Graphs
Dive deeper into your data with Outerbase's new feature that lets you instantly generate aesthetically pleasing and informative charts directly from your database queries. These visual representations are backed by SQL, offering you easy customization. Simply craft your query, or let EZQL do the heavy lifting, and navigate to the chart tab. Outerbase intelligently selects the most suitable chart type based on your query, offering options such as Bar, Column, Pie, Line, Table, and Single Value graphs. Can't find a chart type you're looking for, let us know! We are always excited to improve our data visualization capabilities.
Seamless Dashboards for Comprehensive Views
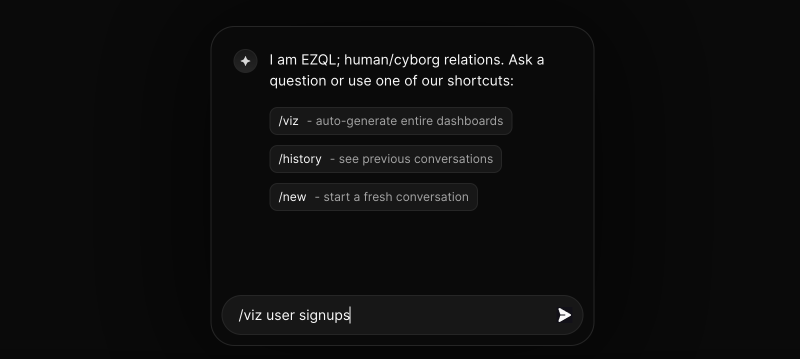
Take your visualizations a step further by creating comprehensive dashboards from your graphs or queries. Effortlessly add new charts and apply filters to tweak your dashboard views based on types, time frames, or even custom metrics. We're also excited to introduce an experimental feature in EZQL: simply type /viz "Your Metric" and watch as it auto-generates an entire dashboard centered around your metric. While still a work in progress, EZQL diligently analyzes your data and the specified metric to create valuable queries.
Embedding Made Easy: Share Your Insights
Now that you have crafted visually appealing charts and dashboards within Outerbase, sharing them is a breeze. Whether you're looking to incorporate them into a presentation or embed them directly into your app, Outerbase ensures a seamless experience. This feature eliminates the need for setting up a charting library and styling graphs manually. Instead, you can share your insights in just two clicks.
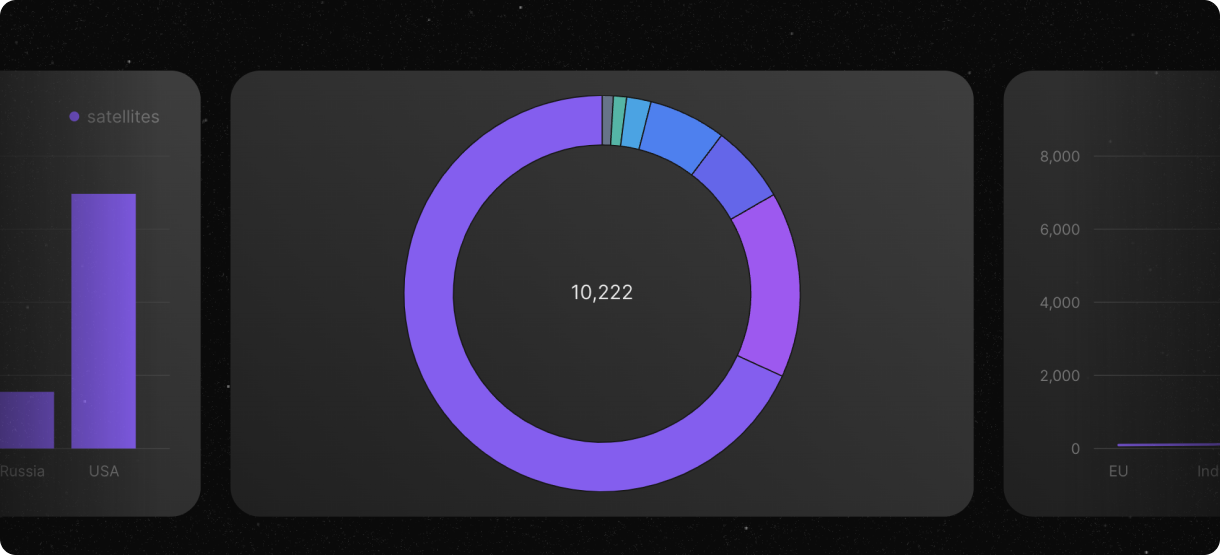
I've actually embedded a live chart, which is being populated from one of our demo databases. You can hover over it to see the different values and it will live update whenever the data changes.
What's Next?
We're dedicated to continually enhancing your visualization experience. Our roadmap includes making charts and dashboards even more customizable, allowing you to infuse your branding and style. Stay tuned for more updates on charts and graphs soon, and as always, keep exploring!