Visualize your data
Turn data into charts in seconds using your queries or simply ask AI to get
thoughtful insights on what matters most.
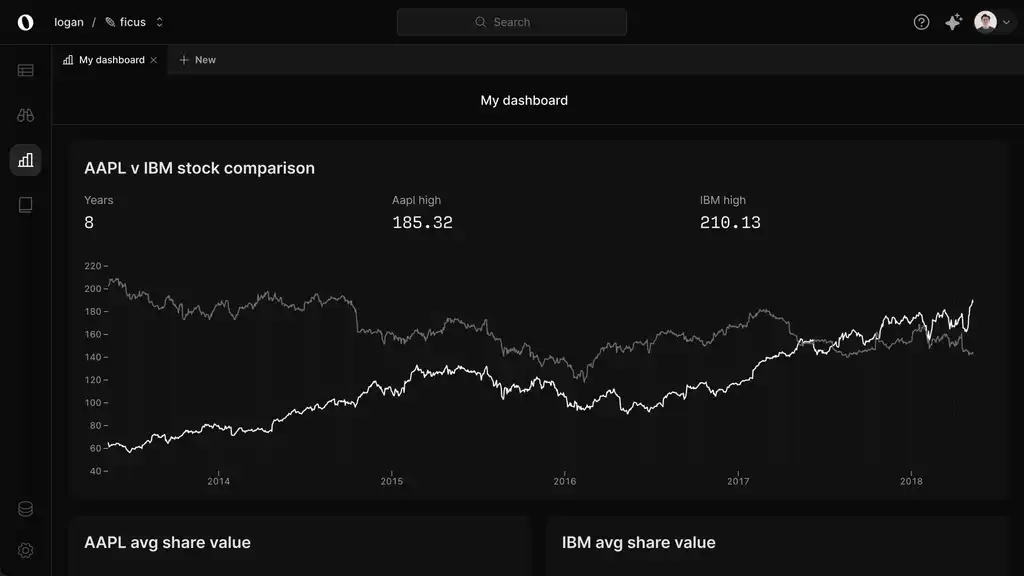
Build fast
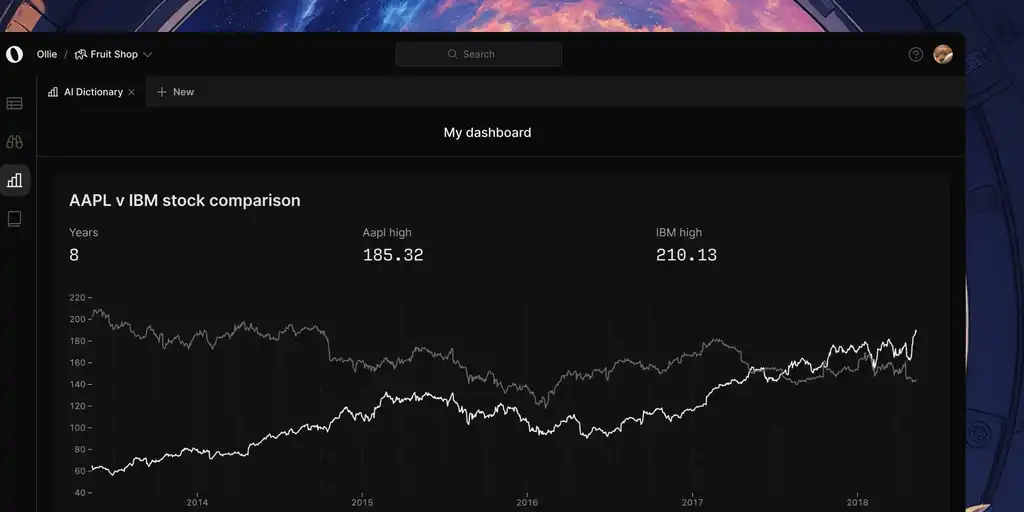
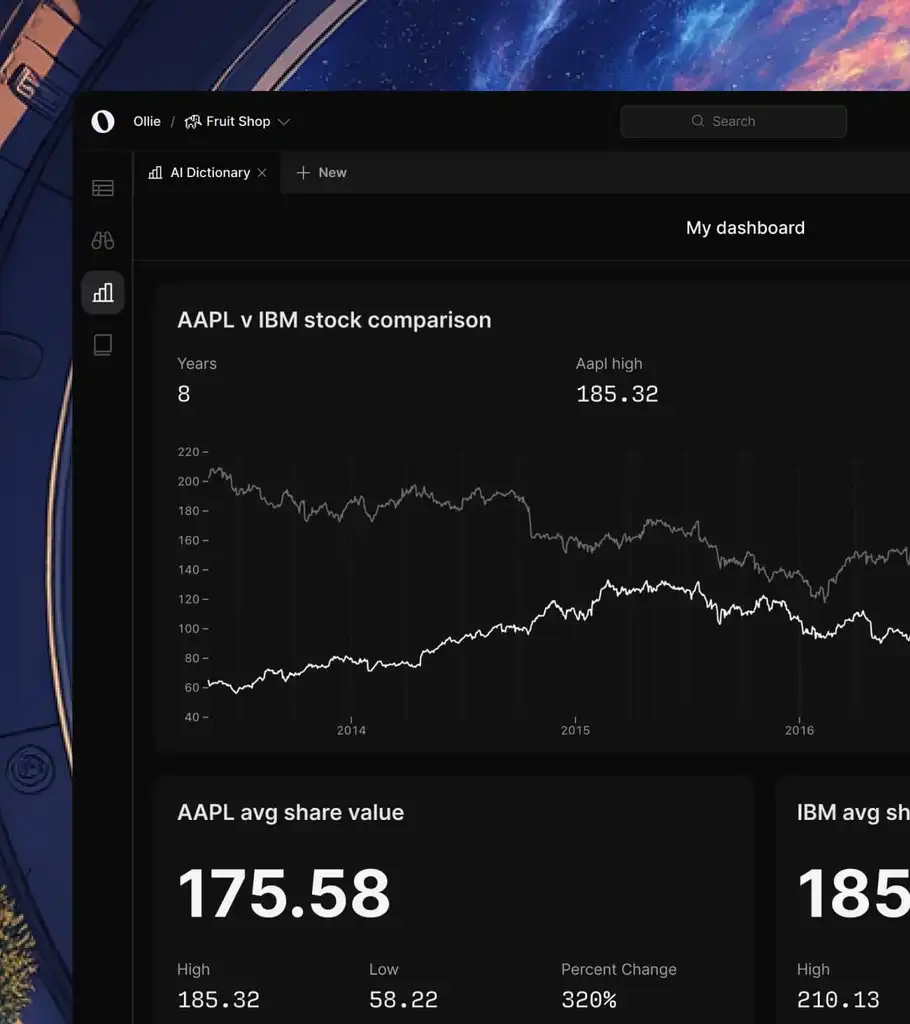
Self-serve analytics
Create dashboards from scratch or let AI build them for you, powered by both SQL and NoSQL queries.
->
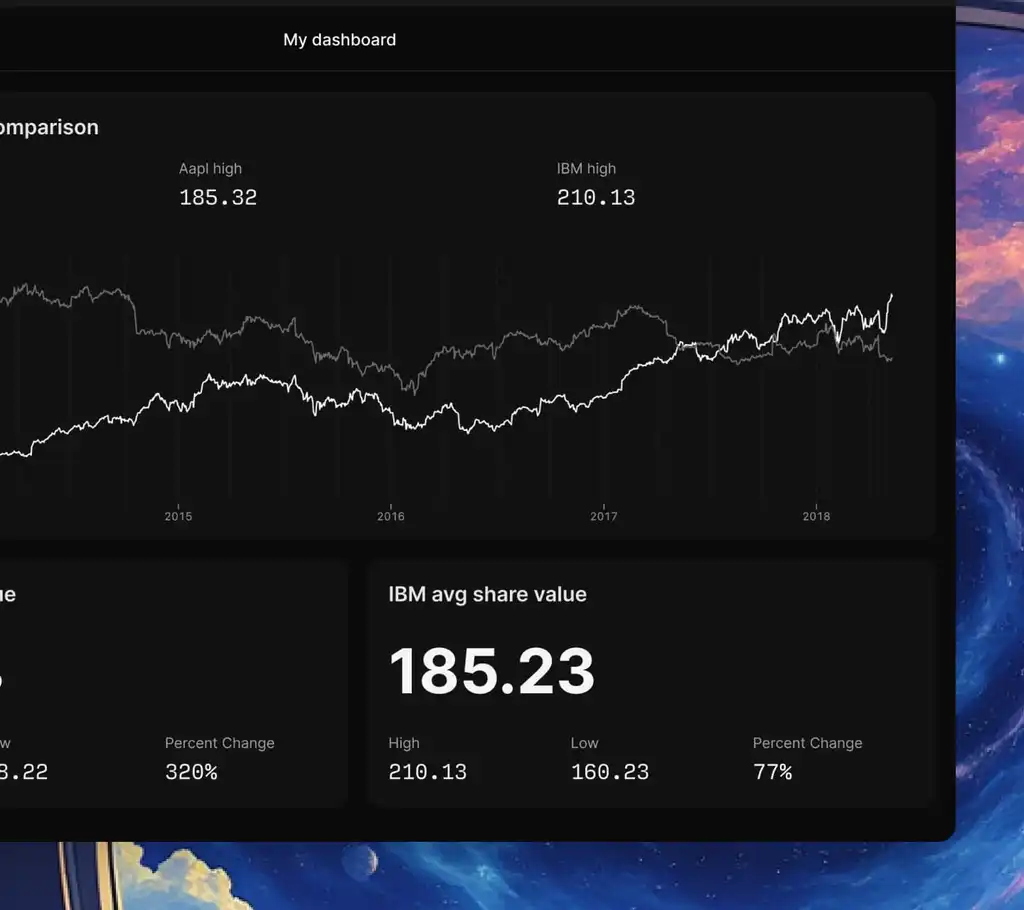
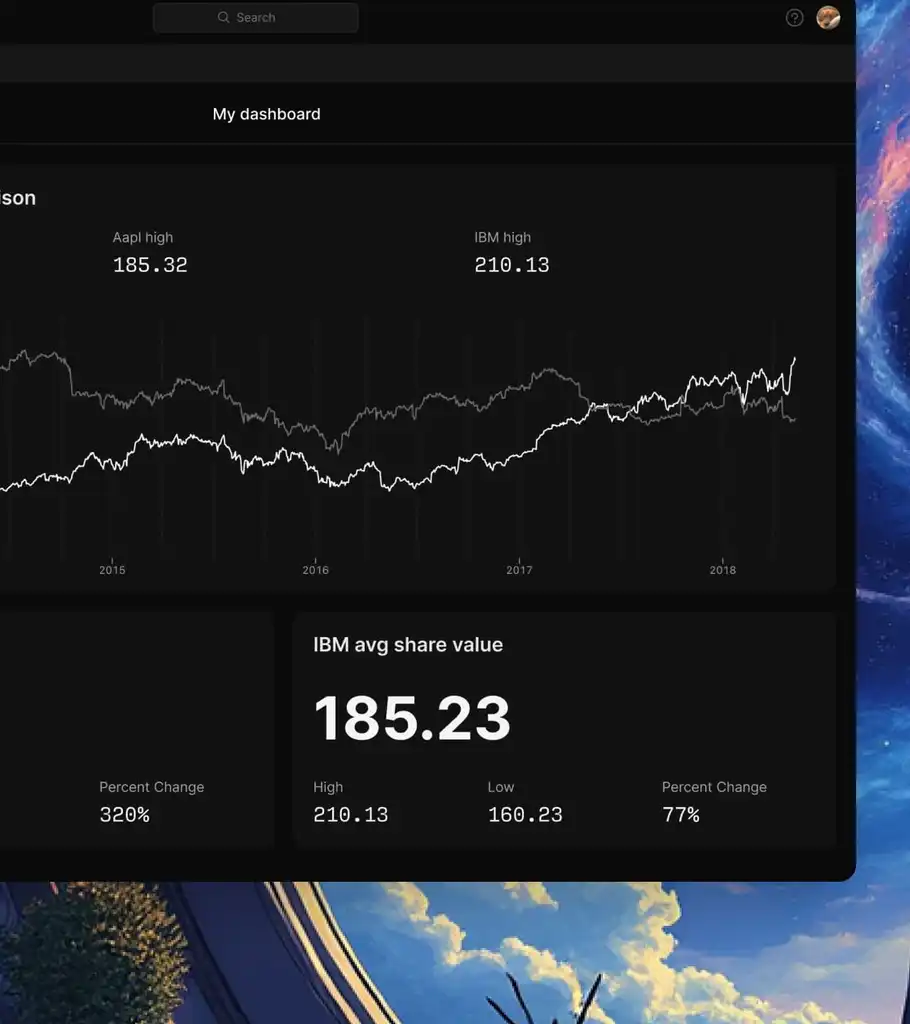
Build better dashboards
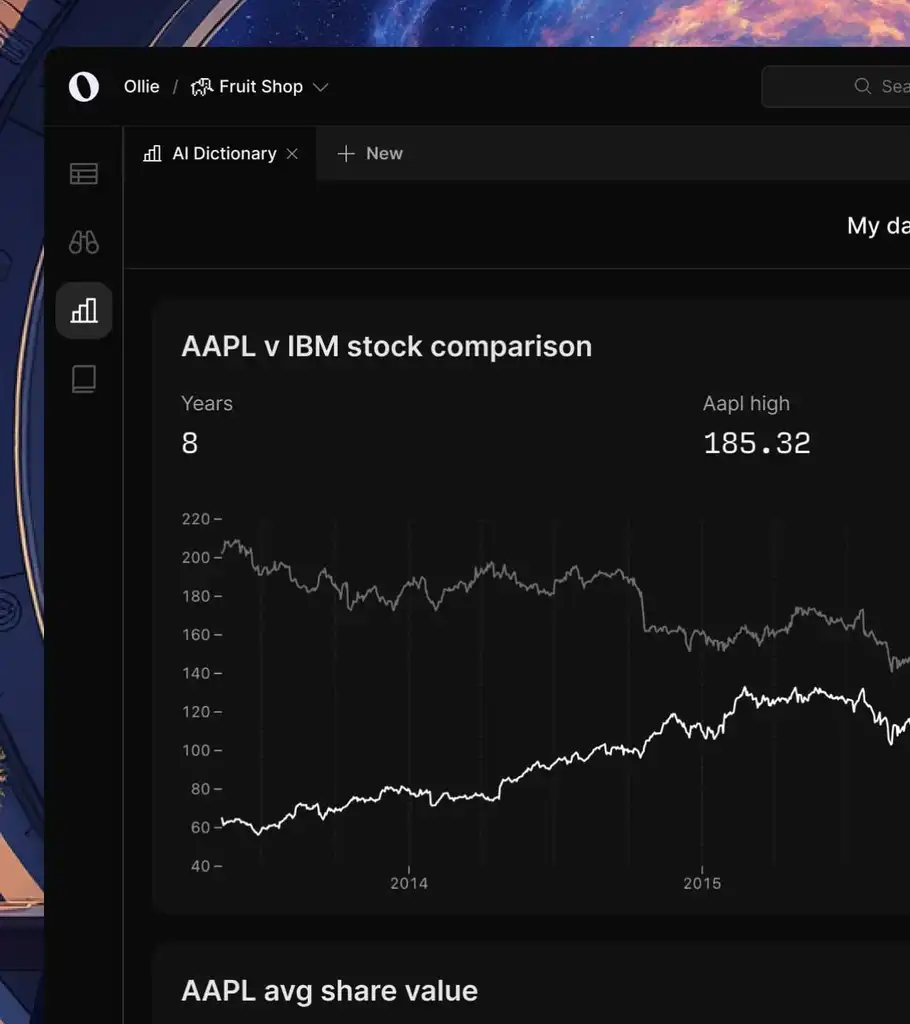
Setup
Select your chart type: bar, area, line, table, scatterplot, and more.
Customize
Update colors, legends, axis, labels to fit your brands needs.
Highlight
Add data callouts to charts to easily track the important metrics.
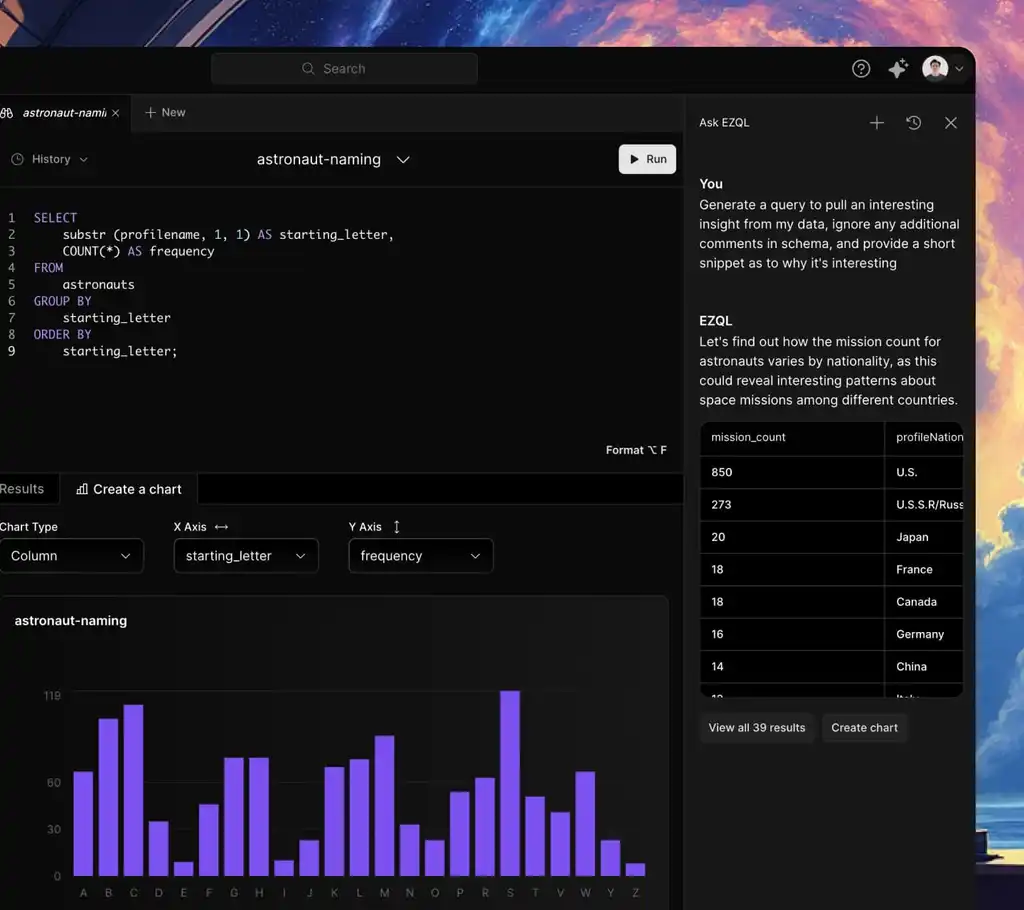
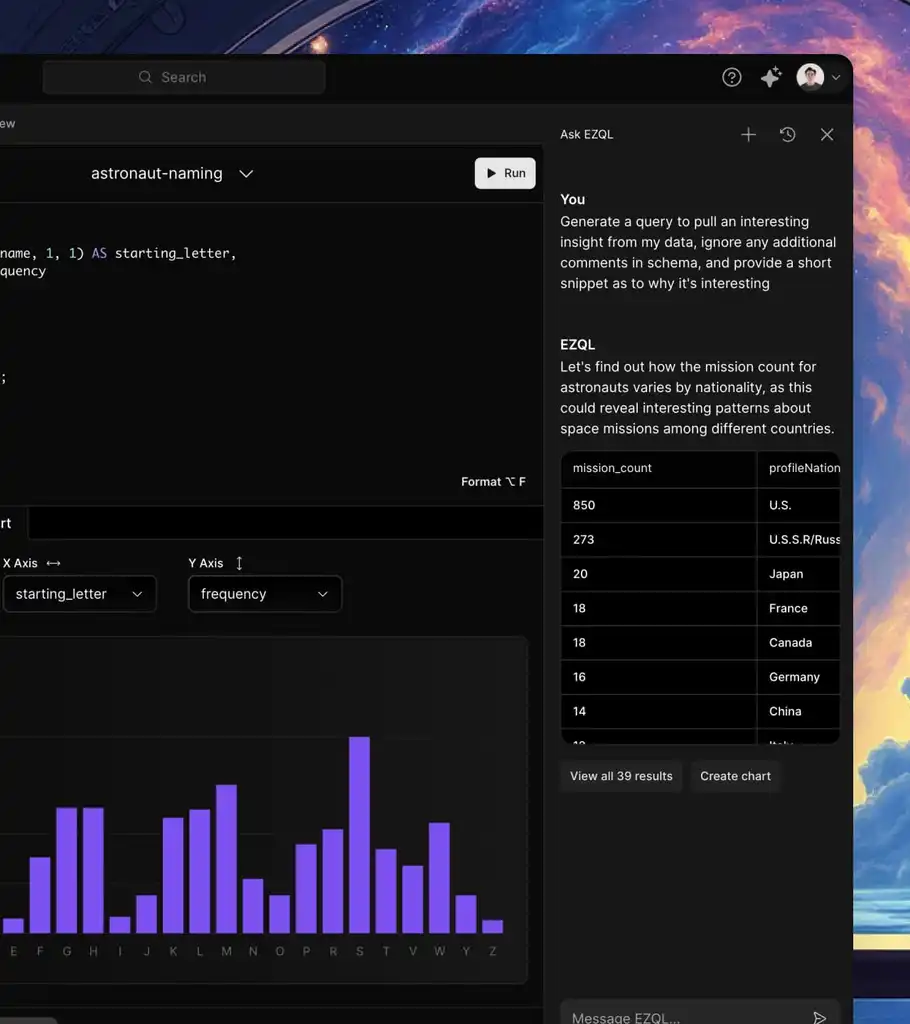
Intelligence
Generative AI-powered insights
Create charts instantly from your conversations with our AI, EZQL™, refine them, and build complete dashboards from your data.
->
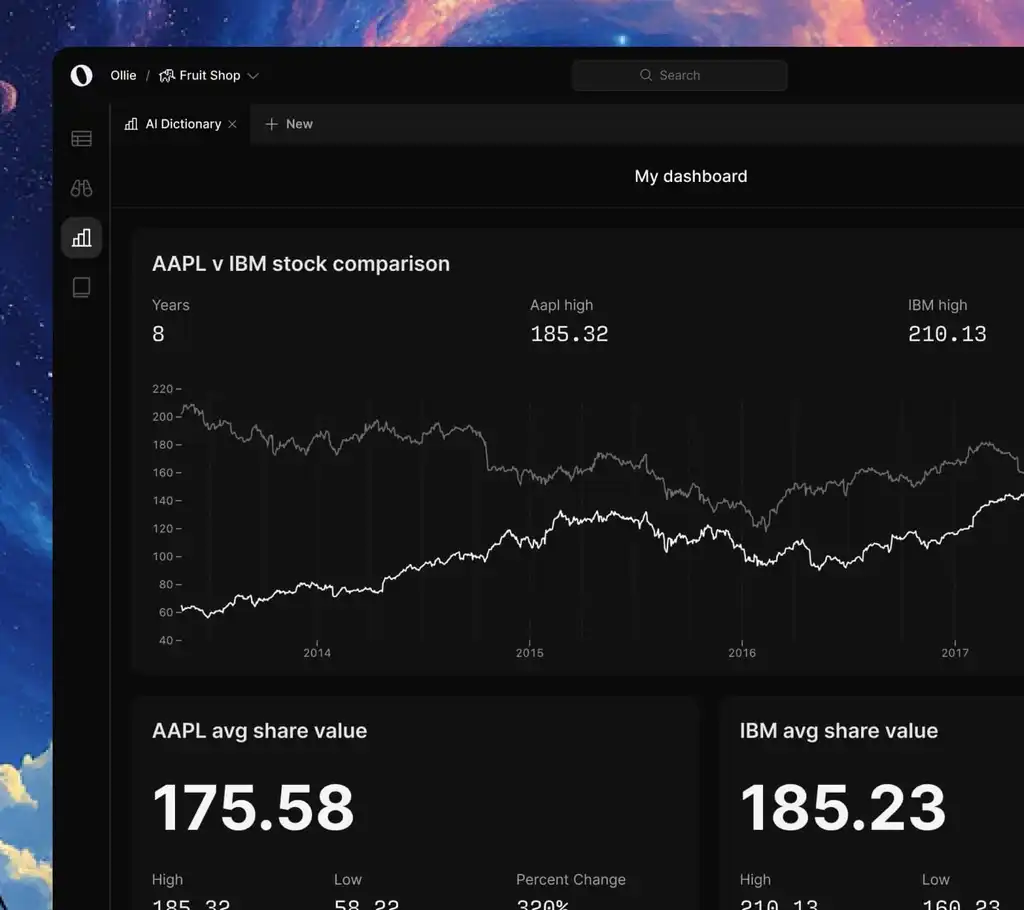
Embed anywhere
Embed our charts anywhere
Our open-source web components work with any framework or vanilla JavaScript, letting you embed charts wherever you need—without reaching for clunky iframes.
->